> ## Documentation Index
> Fetch the complete documentation index at: https://docs.pixldata.com/llms.txt
> Use this file to discover all available pages before exploring further.
# Performance Analytics
> Read a project's health in PixlHub's Performance tab: throughput trends, first-pass quality rate, rework, skip and reviewer edit rates, with date filtering and export.
Labeling operations fail quietly: throughput drifts down, rework creeps up, and nobody notices until the deadline does. The **Performance** tab turns those drifts into numbers you can check in thirty seconds a week.
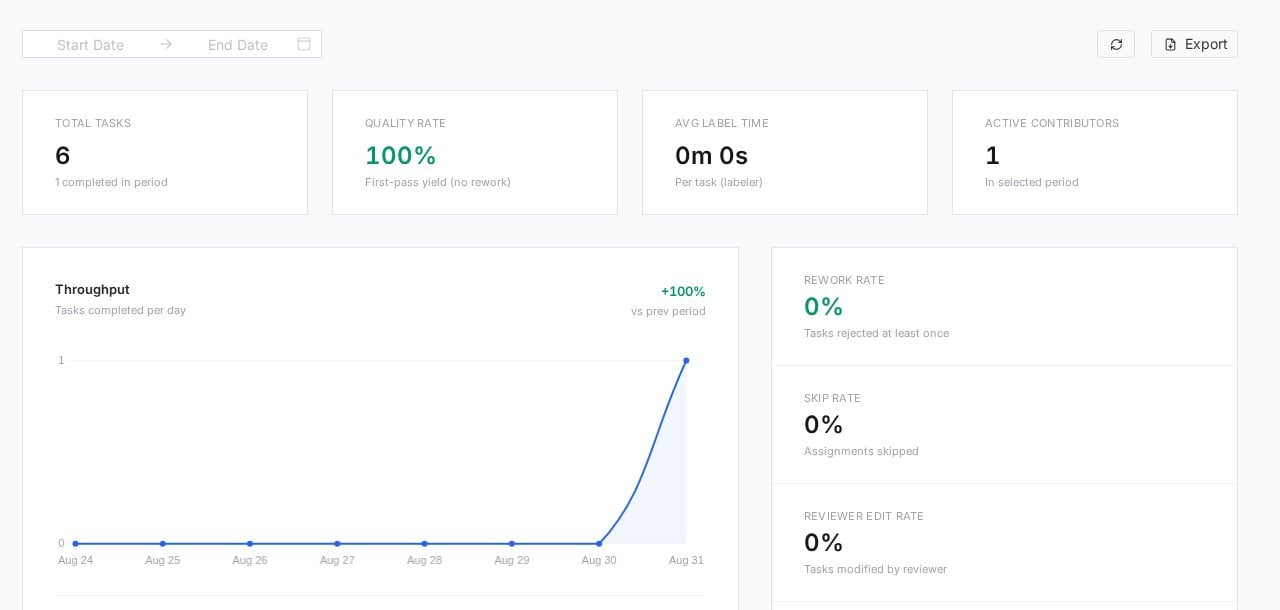 ## The headline cards
| Card | What it measures |
| ----------------------- | ----------------------------------------------------------------------- |
| **Total Tasks** | Project size, with completions in the selected period |
| **Quality Rate** | First-pass yield: the share of tasks that cleared review without rework |
| **Avg Label Time** | Time per task on the labeling side |
| **Active Contributors** | How many people actually worked in the period |
**Throughput** charts completed tasks per day against the previous period, so a "+40%" or a sagging line is visible before anyone writes a status report.
## The quality signals
Three rates on the right tell you where quality really stands:
* **Rework Rate**, tasks rejected at least once: the direct cost of unclear guidelines or rushed labeling.
* **Skip Rate**, assignments skipped: rising skips usually mean confusing data or missing guideline coverage, not lazy annotators.
* **Reviewer Edit Rate**, tasks modified by the reviewer: quick fixes in review are convenient, but a high rate means labelers never learn what reviewers keep correcting.
These three move together in tellable patterns: high rework with low reviewer edits means feedback loops work; low rework with high reviewer edits means reviewers silently absorb the quality gap. Aim for both low, with feedback flowing through [rejections and comments](/guides/quality/review-workflow).
## Scope and share
The **date range** filter scopes every card and chart to the window you care about (sprint, week, delivery batch), and **Export** takes the numbers out for client reports or your own dashboards.
## A weekly reading habit
1. Throughput trend first: is the pace holding against last period?
2. Quality Rate second: is first-pass yield stable while pace holds?
3. If either slipped, the three rates plus the [Tasks](/guides/essentials/tasks) table localize it: which batch, which day, which step.
Five minutes, once a week, and the project never surprises you.
## Frequently asked questions
Metrics reflect completed review cycles within the selected period; a task rejected and still in rework counts when its journey resolves. Widen the date range to see the full cycle.
Active Contributors counts participation in the period, and the Tasks table's per-task ownership, duration and history provide the per-person view for deeper digging.
## Next steps
The process behind the quality numbers.
The per-task detail when a metric needs explaining.
## The headline cards
| Card | What it measures |
| ----------------------- | ----------------------------------------------------------------------- |
| **Total Tasks** | Project size, with completions in the selected period |
| **Quality Rate** | First-pass yield: the share of tasks that cleared review without rework |
| **Avg Label Time** | Time per task on the labeling side |
| **Active Contributors** | How many people actually worked in the period |
**Throughput** charts completed tasks per day against the previous period, so a "+40%" or a sagging line is visible before anyone writes a status report.
## The quality signals
Three rates on the right tell you where quality really stands:
* **Rework Rate**, tasks rejected at least once: the direct cost of unclear guidelines or rushed labeling.
* **Skip Rate**, assignments skipped: rising skips usually mean confusing data or missing guideline coverage, not lazy annotators.
* **Reviewer Edit Rate**, tasks modified by the reviewer: quick fixes in review are convenient, but a high rate means labelers never learn what reviewers keep correcting.
These three move together in tellable patterns: high rework with low reviewer edits means feedback loops work; low rework with high reviewer edits means reviewers silently absorb the quality gap. Aim for both low, with feedback flowing through [rejections and comments](/guides/quality/review-workflow).
## Scope and share
The **date range** filter scopes every card and chart to the window you care about (sprint, week, delivery batch), and **Export** takes the numbers out for client reports or your own dashboards.
## A weekly reading habit
1. Throughput trend first: is the pace holding against last period?
2. Quality Rate second: is first-pass yield stable while pace holds?
3. If either slipped, the three rates plus the [Tasks](/guides/essentials/tasks) table localize it: which batch, which day, which step.
Five minutes, once a week, and the project never surprises you.
## Frequently asked questions
Metrics reflect completed review cycles within the selected period; a task rejected and still in rework counts when its journey resolves. Widen the date range to see the full cycle.
Active Contributors counts participation in the period, and the Tasks table's per-task ownership, duration and history provide the per-person view for deeper digging.
## Next steps
The process behind the quality numbers.
The per-task detail when a metric needs explaining.